
Nursing exam analytics best practices are defined as the systematic use of validated performance data, readiness scores, and clinical judgment indicators to guide NCLEX preparation and improve pass rates. First-time US-educated candidates saw their pass rate drop to 87.1% in 2025, down from 91.2% the year before. That decline signals a clear need for smarter, data-driven preparation. The National Council of State Boards of Nursing (NCSBN) has reset standards with the 2026 NCLEX test plan, making evidence-based analytics not optional but necessary for both students and educators.
1. What are the essential components of a nursing exam analytics system?
A sound nursing exam analytics system starts with psychometric validation. Psychometrically validated exam items prevent false readiness signals by confirming that each question actually measures what it claims to measure. Without this foundation, a student can score well on a poorly designed exam and still fail the NCLEX.

The most effective systems use a multi-indicator readiness model rather than a single score. Joyce University replaced a single high-stakes test with a composite approach that integrates course grades, standardized predictor assessments, and remediation records. Their benchmark requires a 74% raw average across two attempts on the ATI RN Comprehensive Predictor, replacing the older single 95% pass probability threshold. That shift reflects a broader industry move toward composite readiness evidence.
Core data types in a complete analytics system include:
- Course performance scores across all nursing content domains
- Standardized readiness benchmark scores from predictor assessments
- Clinical judgment indicators tied to NCSBN's Clinical Judgment Measurement Model
- Remediation completion records showing whether students acted on their data
- Time-to-test metrics tracking how long students wait between assessments and their NCLEX attempt
Pro Tip: Track remediation completion alongside your readiness scores. A high score with zero remediation activity is a warning sign, not a green light.
2. How can nursing students use exam data analytics to improve NCLEX preparation?
Readiness scores are the single strongest predictor of NCLEX success when interpreted correctly. Students who score "high" on four consecutive readiness assessments maintain a 98.98% NCLEX pass rate. That consistency matters far more than one strong result on a single attempt.
Pace your assessments strategically
Back-to-back assessments without study between them produce poor predictive value. Spacing assessments 3–5 days apart with targeted remediation in between improves score reliability and NCLEX outcomes. Think of each assessment as a diagnostic checkpoint, not a finish line.
Use heat maps to find your weak spots
Most analytics platforms display performance by content category. Use these category breakdowns to identify which NCLEX client needs areas or clinical judgment subcategories are pulling your score down. A student who scores 80% overall but only 55% in pharmacology needs to address pharmacology specifically, not study everything again.
Study rationales, not just answers
The 2026 NCLEX tests clinical reasoning, not recall. Students who memorize correct answers without understanding the rationale behind them fail under the Next Generation NCLEX (NGN) format. Read every rationale for every missed question. That habit builds the clinical judgment framework the exam actually measures.
Handle Select All That Apply questions with discipline
SATA questions reward conservative, evidence-based thinking. Students who select options they are uncertain about consistently score lower on these item types. Analytics data showing repeated SATA errors signals a reasoning gap, not a knowledge gap.
Pro Tip: After each practice session, sort your missed questions by content category. If the same category appears three sessions in a row, that is your priority for the next remediation block.
3. What are best practices for educators to leverage exam analytics in nursing programs?
Educators who use analytics effectively treat them as a continuous quality improvement tool, not an end-of-semester report card. Programs using monthly and quarterly readiness reviews see improved intervention efficacy and can maintain exam failure rates below 20% per course. That kind of result requires governance, not just good intentions.
Key educator best practices include:
- Centralized assessment governance: Assign a faculty committee to oversee exam blueprinting, item quality, and psychometric review. Inconsistent item quality across faculty creates misleading cohort data.
- Multi-metric dashboards: Monitor readiness scores, remediation completion rates, clinical judgment indicators, and time-to-test in one view. Single-metric monitoring misses students who look fine on one measure but are at risk on another.
- Faculty training on item writing: Faculty who write poor exam items generate noise in the analytics data. Training on NCSBN's Clinical Judgment Measurement Model and NGN item formats is not optional for programs serious about data quality.
- Individual and cohort-level remediation: Analytics should trigger both one-on-one advising for at-risk students and curriculum adjustments when an entire cohort underperforms in a content domain.
- Accreditation alignment: Analytics systems must align with ACEN and CCNE accreditation standards, which increasingly require documented evidence of data-driven program improvement.
| Analytics Practice | Frequency | Purpose |
|---|---|---|
| Readiness score review | Monthly | Identify at-risk students early |
| Cohort performance dashboard | Quarterly | Adjust curriculum and instruction |
| Item psychometric audit | Per exam cycle | Remove or revise poor-quality items |
| Remediation completion check | Weekly | Confirm students act on their data |
| Faculty item-writing review | Annually | Maintain assessment validity |
4. What common pitfalls and misconceptions exist in using nursing exam analytics?
The most damaging misconception is that a single high score means a student is ready. Analytics are an intelligence layer, not a pass/fail verdict. One strong result on a readiness assessment tells you where a student stood on one day. It says nothing about consistency, clinical reasoning depth, or performance under real exam conditions.
Common pitfalls that undermine analytics accuracy:
- Cramming assessments without remediation: Students who retake readiness assessments immediately without studying between attempts generate scores that overestimate readiness. The data becomes noise.
- Treating memorization as mastery: The NGN format penalizes students who memorize facts without understanding clinical context. Analytics that show strong recall scores can mask weak clinical judgment.
- Ignoring performance variability: A student who scores 80% one week and 60% the next has a variability problem. Averaging those scores hides the risk.
- Skipping test condition simulation: Students who practice in low-stakes, distracted environments perform worse on the actual NCLEX than their analytics predict. Simulation conditions matter for data accuracy.
- Overconfidence after borderline scores: Borderline scores carry significantly lower pass probabilities than consistent high scores. Students who stop studying after a borderline result are making a statistically poor decision.
"Scores highlight specific unmastered activity statements in the NCLEX test plan. Analytics complement study. They do not replace it. A student who treats a readiness score as a finish line has misread the data entirely."
5. Comparison of nursing exam analytics features: key metrics, indicators, and visualization tools
Understanding which metrics to monitor, and what each one actually tells you, separates programs that improve from programs that just collect data. Analytics dashboards in nursing education combine leading indicators (early warning signals) with lagging indicators (final outcome measures) to give a complete picture of readiness.
| Metric or Tool | Type | What It Measures | Why It Matters |
|---|---|---|---|
| Readiness score | Leading indicator | Predicted NCLEX pass probability | Guides study prioritization before the exam |
| Heat map by content area | Visualization | Performance gaps across NCLEX domains | Targets remediation to specific weak areas |
| Remediation completion rate | Operational indicator | Whether students act on their data | Predicts whether score improvement will follow |
| Trend line over time | Visualization | Score trajectory across multiple attempts | Identifies consistent improvement or decline |
| Time-to-test metric | Lagging indicator | Days between readiness clearance and NCLEX | Flags students who delay testing after clearing |
| Faculty performance indicator | Quality indicator | Item difficulty, discrimination, and reliability | Ensures exam data is worth analyzing |
| Pass probability score | Leading indicator | Statistical likelihood of passing NCLEX | Supports advising and remediation decisions |
The most underused metric in most programs is the faculty performance indicator. When exam items have poor discrimination values, the entire dataset built from those items is unreliable. Programs that audit item quality regularly produce analytics that actually predict outcomes. Programs that skip this step are analyzing noise.
Pro Tip: Ask your program director which items on your last exam had discrimination indices below 0.20. Those questions may have cost you accurate data, not just points.
Key takeaways
Consistent, spaced readiness assessments combined with targeted remediation and multi-indicator analytics are the strongest predictors of NCLEX success under 2026 standards.
| Point | Details |
|---|---|
| Consistency beats single scores | Students with four consecutive high readiness scores pass at a 98.98% rate. |
| Space your assessments | Allow 3–5 days between attempts and remediate specifically between each one. |
| Multi-indicator models outperform single tests | Composite data from courses, predictors, and remediation records predicts outcomes better than one score. |
| Educators need governance structures | Monthly and quarterly analytics reviews with faculty training reduce failure rates measurably. |
| Analytics are diagnostic, not definitive | A score tells you where to study next, not whether you are ready to test. |
Why I think most nursing students misread their analytics data
Most students I have worked with treat their readiness score like a grade. They see 78% and think "passing." They see 85% and think "done." Neither reaction is correct. A readiness score is a diagnostic signal, not a verdict.
The students who use analytics well treat every score as a question: "What does this tell me about where I am weak?" They pull up their category breakdown before they close the platform. They write down the two or three content areas where they dropped points. Then they study those areas specifically before they test again. That habit, repeated consistently, is what produces the kind of score trajectory that actually predicts NCLEX success.
The educators who build strong programs do something similar at the cohort level. They do not wait for students to fail. They monitor NCLEX readiness over time and intervene when trend lines flatten or drop. They treat analytics as a living system, not a semester-end report.
The uncomfortable truth is that analytics only work if you act on them. A student who reviews their heat map and then studies the same content they already know has wasted the data. The point of the data is to make you uncomfortable. It is supposed to show you what you do not know. That discomfort is the signal. Follow it.
— Michael
Nursepass: analytics built for NCLEX success
Nursepass gives nursing students and educators the analytics infrastructure that 2026 NCLEX standards demand. The platform's live readiness score updates after every practice session, and subcategory heat maps show exactly which content domains need attention. Over 3,000 nursing students have used Nursepass, with active users reporting a 95% pass rate.
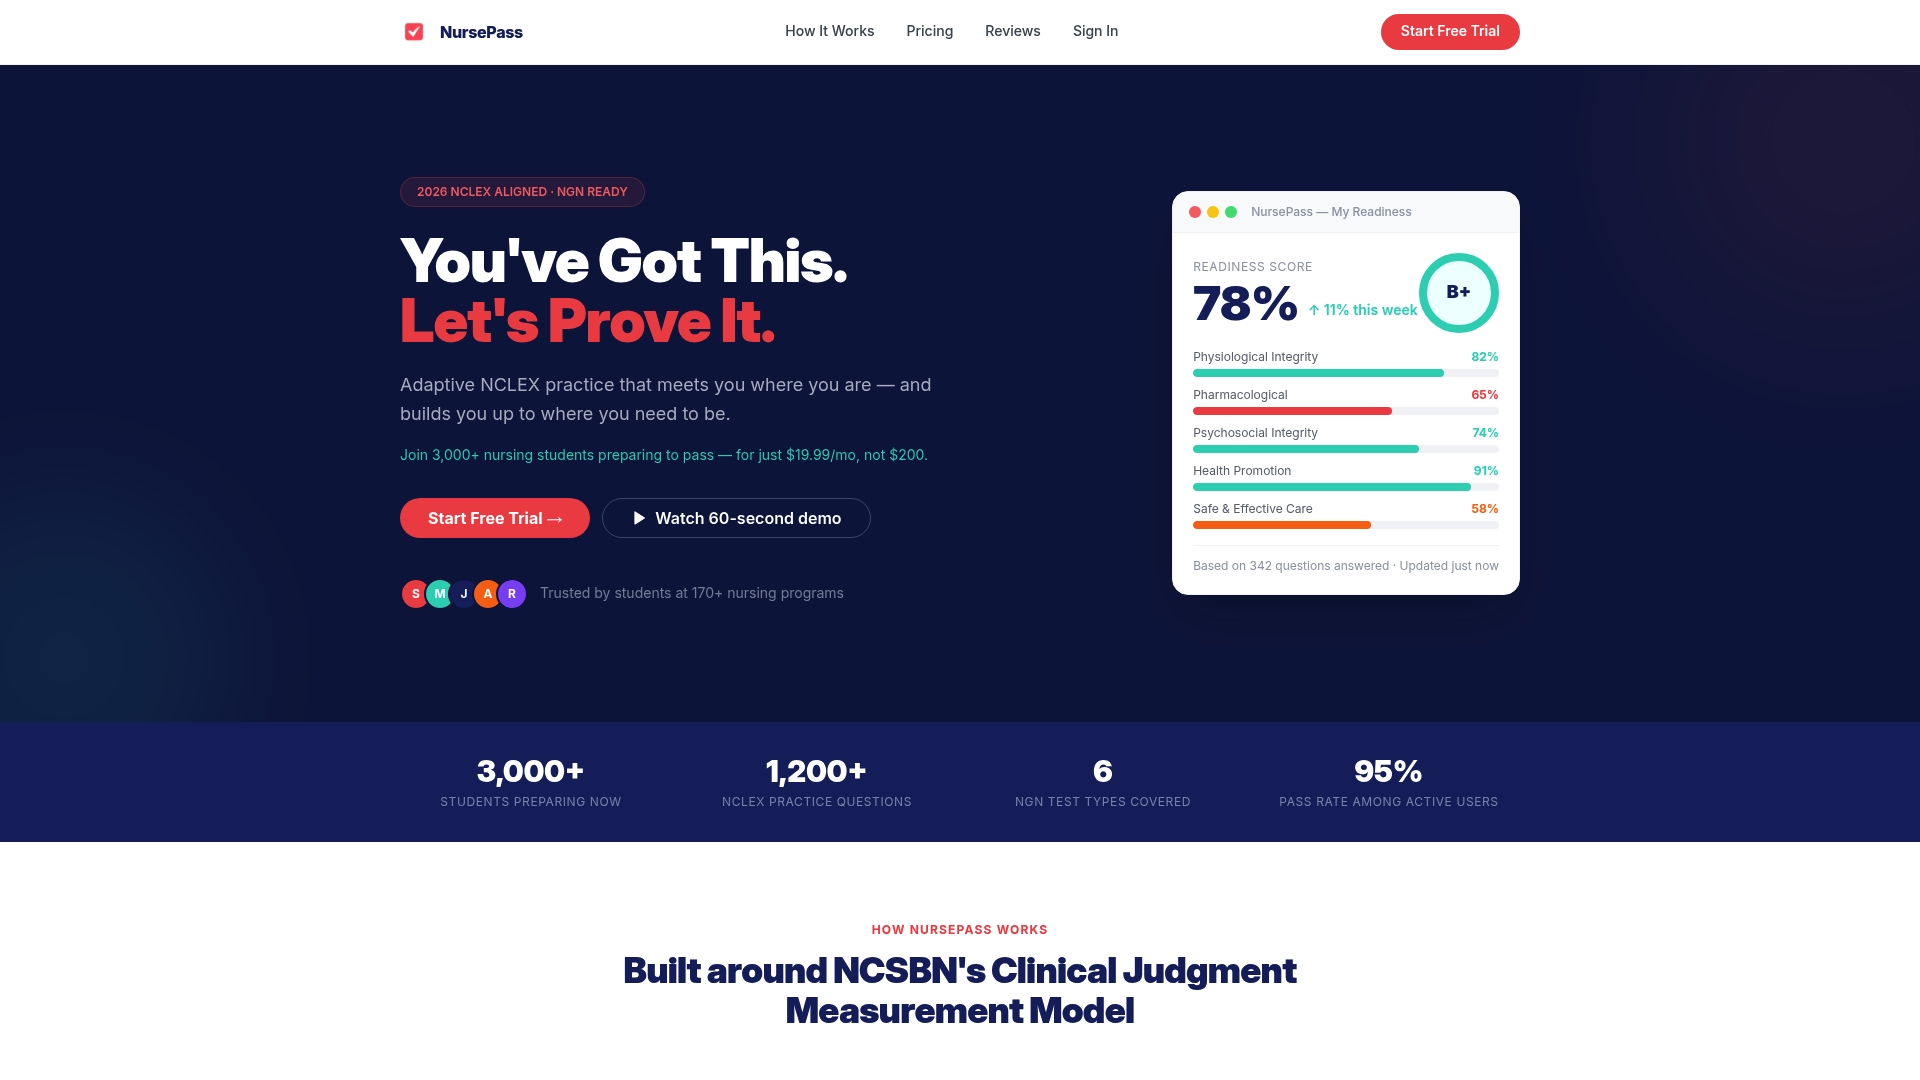
The adaptive engine behind Nursepass adjusts question difficulty to match your current competency level. That means every session generates data that reflects where you actually are, not where you were last month. With more than 1,200 NCLEX practice questions aligned to the 2026 test plan, Nursepass connects the accuracy improvement techniques this article covers to a platform built to act on them.
FAQ
What is the best way to use readiness scores for NCLEX prep?
Treat readiness scores as diagnostic tools, not pass/fail verdicts. Students who score "high" on four consecutive assessments pass the NCLEX at a 98.98% rate, so consistency across multiple attempts matters more than any single result.
How often should nursing students take readiness assessments?
Space assessments 3–5 days apart with targeted remediation between each attempt. Back-to-back testing without study between sessions produces unreliable scores and poor NCLEX outcomes.
What does a nursing exam heat map show?
A heat map displays your performance broken down by content category or NCLEX domain. It shows which specific areas are pulling your overall score down so you can focus remediation where it counts.
How can educators use analytics to reduce NCLEX failure rates?
Programs that conduct monthly and quarterly readiness reviews using multi-metric dashboards can maintain exam failure rates below 20% per course. The key is acting on the data through targeted remediation and curriculum adjustments, not just collecting it.
What is the difference between a leading and a lagging indicator in nursing analytics?
A leading indicator, like a readiness score or heat map, signals risk before the NCLEX happens. A lagging indicator, like the actual pass or fail result, confirms what already occurred. Effective programs monitor both.